Getting Started
Datavyu is a powerful tool that enables behavioral researchers to code observations from their video for analysis. Designed by researchers for researchers, Datavyu provides an intuitive interface for working with data sources and recording observations, and includes an API for more advanced data manipulation.
The Datavyu Interface
When you first open Datavyu, Datavyu will check if you have the latest version. If there has been a new release, Datavyu will prompt you to update your version.
When you launch Datavyu, you will see two windows: the Controller, and a blank spreadsheet. If you add a data source, a third window containing the data source will appear.
The following sections describe each component of the Datavyu interface.
Media Player
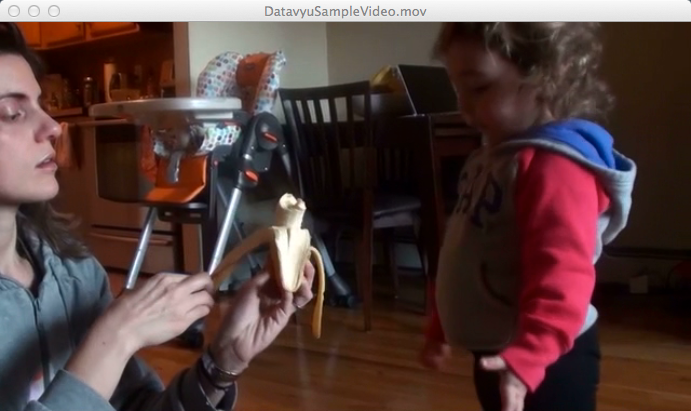
The Media Player is the window that presents the data source that the user is working with.
Adding a video or other data source to Datavyu is as easy as clicking on the Add Data… button in the Controller. For a more detailed overview of adding data sources see: Add Data.
Once you’ve added a data source, it’s time to add columns, create observations, and write scripts. The tutorials are there to guide you.
Controller
The Controller allows users to control the playback of their data source and create observations in the spreadsheet. Quite literally, it controls the Media Player, the window that contains the video data.
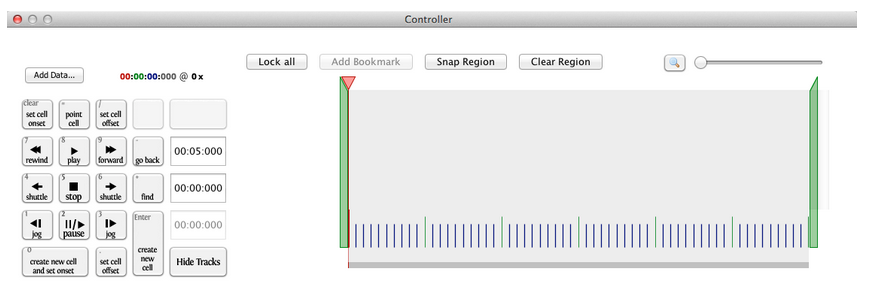
The keypad can be found on the left side of the controller. This section maps directly to the number pad on your keyboard, or to an external number pad if your keyboard does not have one and you’ve connected one to your computer. These keys control playback, and also enable users to set the cell onset and cell offset, create new cells and navigate within the data source. The Add Data… button enables you to add a data source.
For more about the Controller, and a detailed description of its functionality and features, see Controller Overview.
Spreadsheet
The Datavyu spreadsheet is where users record observations from the data source.
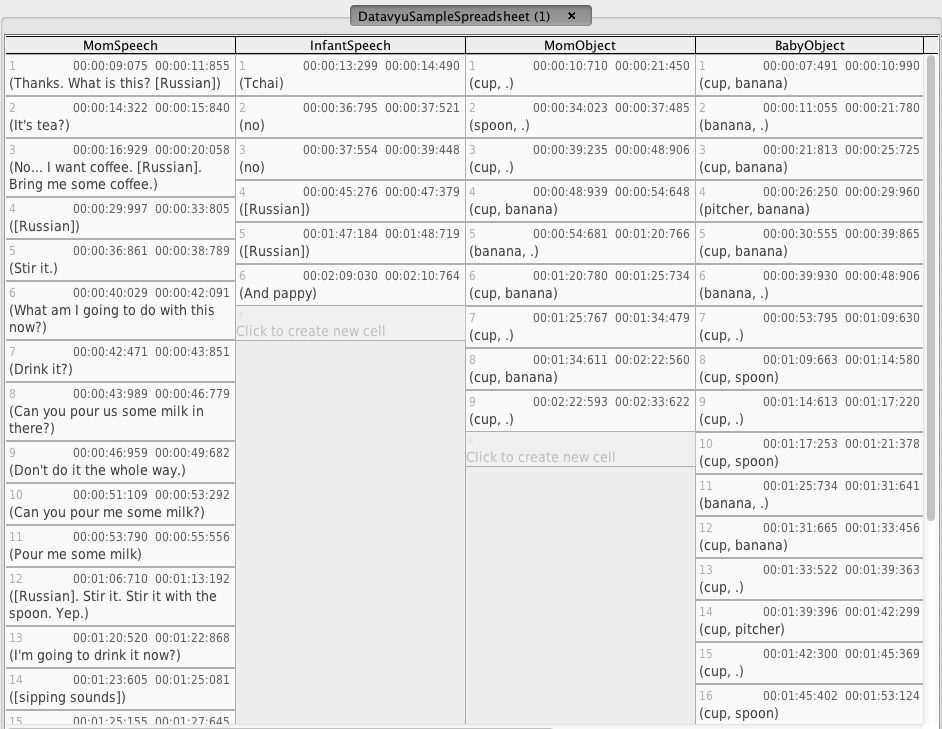
This spreadsheet has four columns: “MomSpeech”, “InfantSpeech”, “MomObject”, “BabyObject”. Each column has numerous coded cells.
Being able to Configure Columns and Codes enables coders to record observations and link them directly to timestamps in the data source. Each user-defined column is represented by a column in the spreadsheet, and observations within a column are sorted in chronological sequence. Looking horizontally across the spreadsheet columns shows what was happening at a given point in time in the data source. Looking vertically down a column shows the sequence in which the observations occurred.
The Spreadsheet Overview document describes the spreadsheet in more detail.